An Unconscious Approach
We can think of the approach of doing a lot of EDA and trying out different models in building the MLE classifier as a conscious approach. A really nice thing about this approach, in addition to the resulting classifier, is that we get to learn lots about how people draw things. Like, you can have a whole pizza, or you can have just a slice. Or most bananas dutifully obey the law of gravity, but some mischievous ones don’t.
Now we try an unconscious approach. Let’s put all the domain knowledge we have aside, and pretend that we never even looked at those images. Let’s see if we can make up for all that with machine brute force. The question is: Can a machine learning algorithm that does not benefit from our human visual perception (and is pretty much a black box) do a decent job at classifying Quick! Draw images? We tried one that is popular for classifying images: a convolutional neural network. We name it OurCNN (not the news channel).
OurCNN specs – version 1.0
Input
32-by-32 image with black/white pixels
Output
a label out of 31 types of food: apple, asparagus, banana, birthday cake, blackberry, blueberry, bread, broccoli, cake, carrot, cookie, donut, grapes, hamburger, hot dog, ice cream, lollipop, mushroom, onion, peanut, pear, peas, pineapple, pizza, popsicle, potato, sandwich, steak, strawberry, string bean, watermelon
Note: This is one category more than the number of categories that went into the MLE classifier. Just an error in copying text :-)
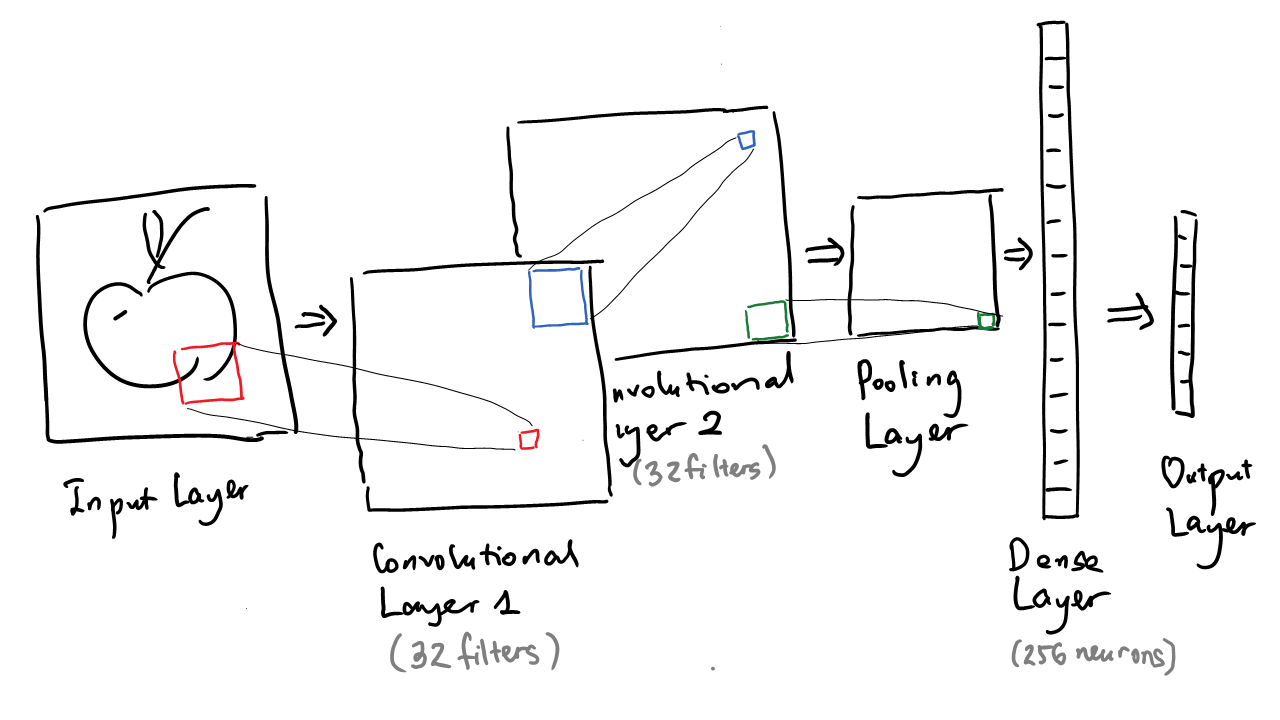
Inside the box
a. Architecture
2 convolution layers, each with the same structure:
- 32 filters of size 3-by-3, applied with padding
- ReLU activation followed by batch normalization
1 max-pooling layer
- filters of size 2-by-2
- followed by 30% dropout
1 dense layer
- 256 neurons
- ReLU activation followed by batch normalization
- 30% dropout
final layer
- 31 neurons (for probabilities of the 31 categories)
- softmax activation
b. Optimization
loss: categorical cross-entropy
metric: accuracy
stochastic gradient descent:
- learning rate 0.001
- decay 1e-6
- momentum 0.9
- Nesterov accelerated
c. Training
20 epochs
batch size 32
use 5000 images per type, split 4:1 into training and validation sets
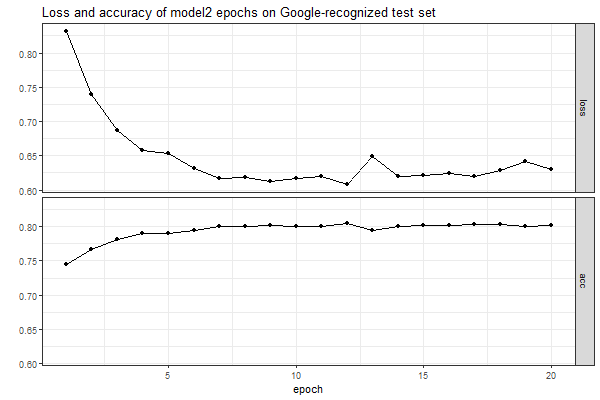
We pick the model at the epoch that combines lowest loss and highest accuracy, here epoch 12 on the validation set (see the training history below)
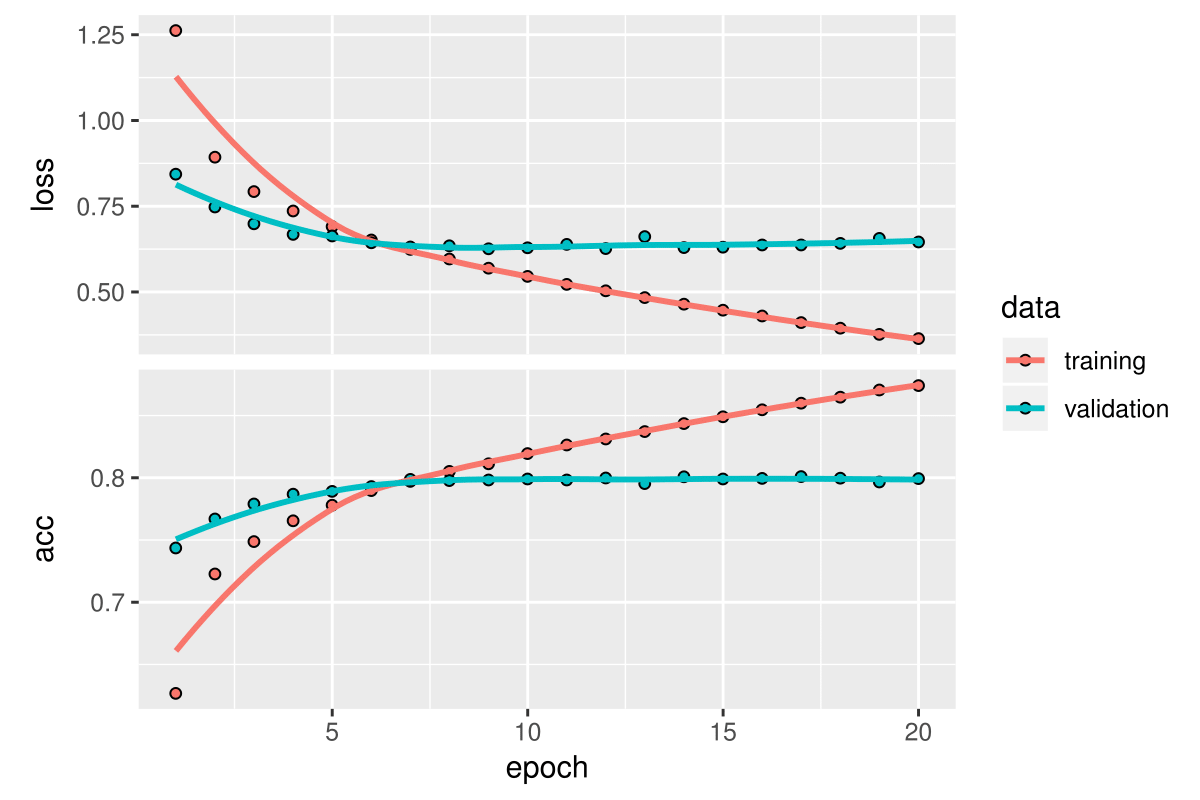
and on a separate test set (see below).
d. Data
Data reduction
Quick, Draw! images are black-and-white and come in 256-by-256 resolution. The data are stroke data, i.e., for each stroke of the pen, a series of points are stored such that if you connect them with straight segments, you recover the stroke.
The MLE classifier keeps the original resolution, but uses only the points that define the segments.
OurCNN uses those points and points between them, but reduces resolution to 32-by-32.
Here are the three data versions for a watermelon, a sandwich, and a pear.
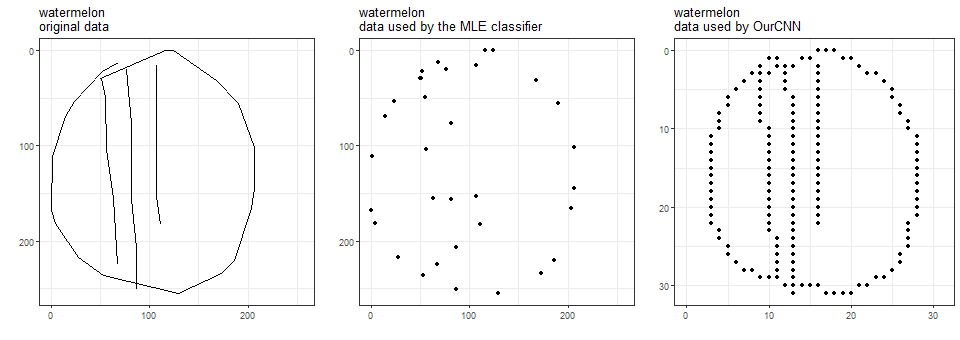
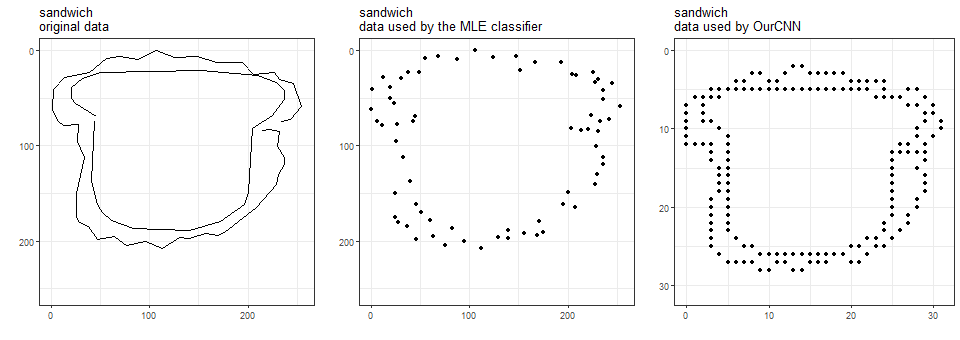
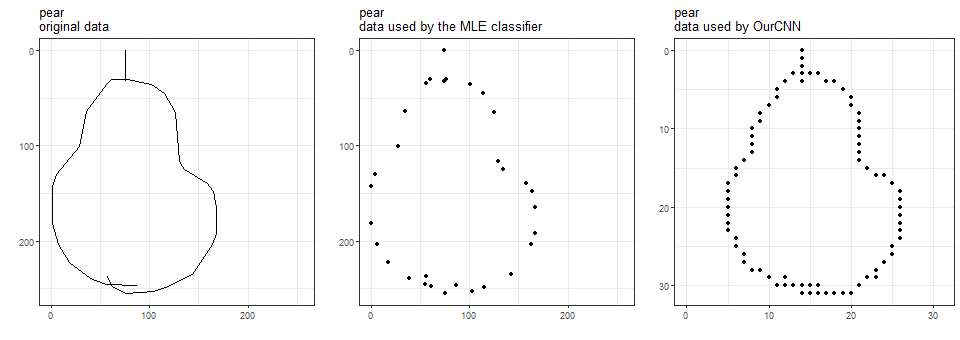
Hmm, it is now clear that we trained the MLE classifier using less data than we did OurCNN.
Other data that neither classifiers use: time, country of origin, and also stroke sequence (relevant in a fascinating analysis of how people draw circles).
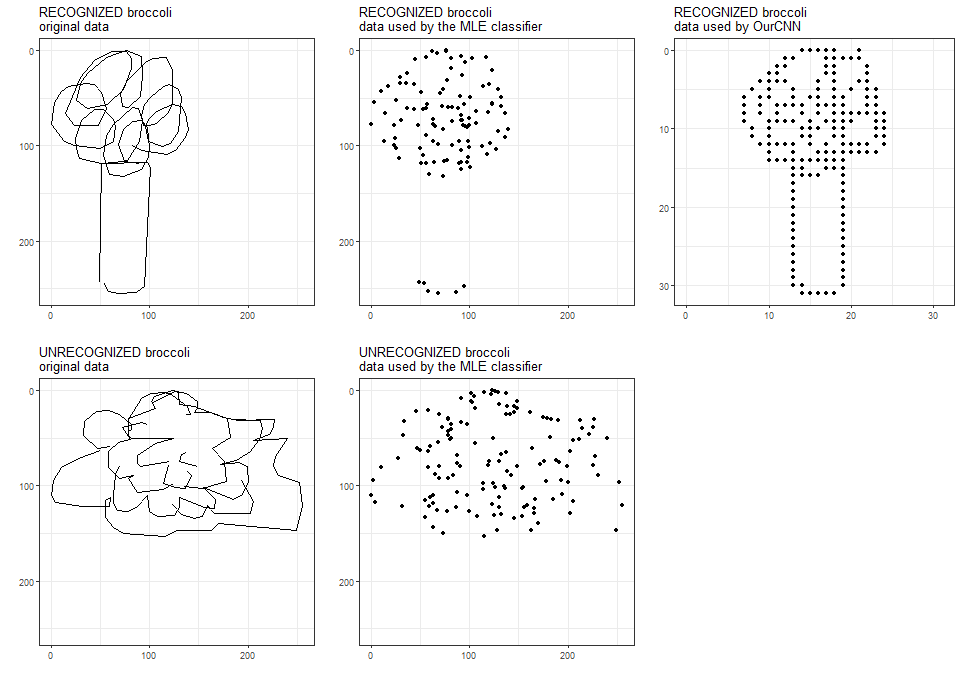
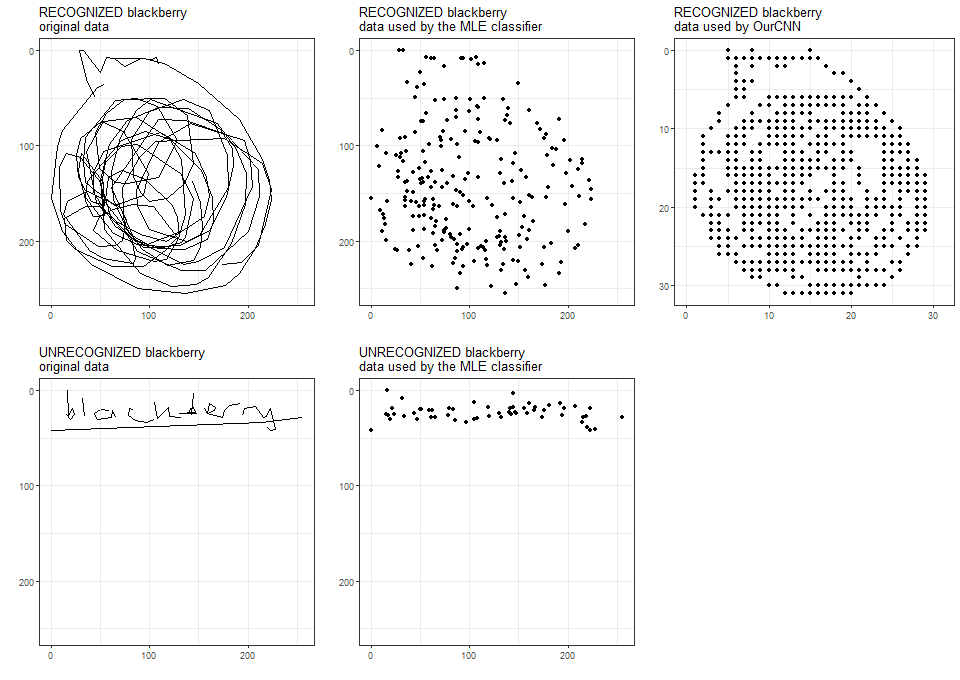
Data subsetting
the MLE classifier was trained on a random sample of images of each type, regardless of whether Google AI recognized what type it is.
OurCNN was trained on a random sample of images recognized by Google AI.
Here are two examples of Google-recognized and Google-unrecognized images.
What we noticed in training OurCNN
A more powerful model performs better than a less powerful model. One with 20 (instead of 32) filters in each convolution layer and 128 (instead of 256) neurons in the dense layer has slightly lower accuracy. Also, more training data results in better accuracy, on the same model.
We could not afford to handle either a more powerful model (e.g., with an additional dense layer) or more data (either more images or higher resolution). This one took more than two days to train on a laptop computer.
OurCNN performance
Relative to Google AI
We are, of course, curious to see how OurCNN performs compared to Google AI on each of these food types. We took a random sample of 1000 images of each food (regardless of whether they are recognized by Google AI or not) and put them through OurCNN. Below is how OurCNN performs on these images, compared to Google AI recognition rates based on the whole dataset available to us.
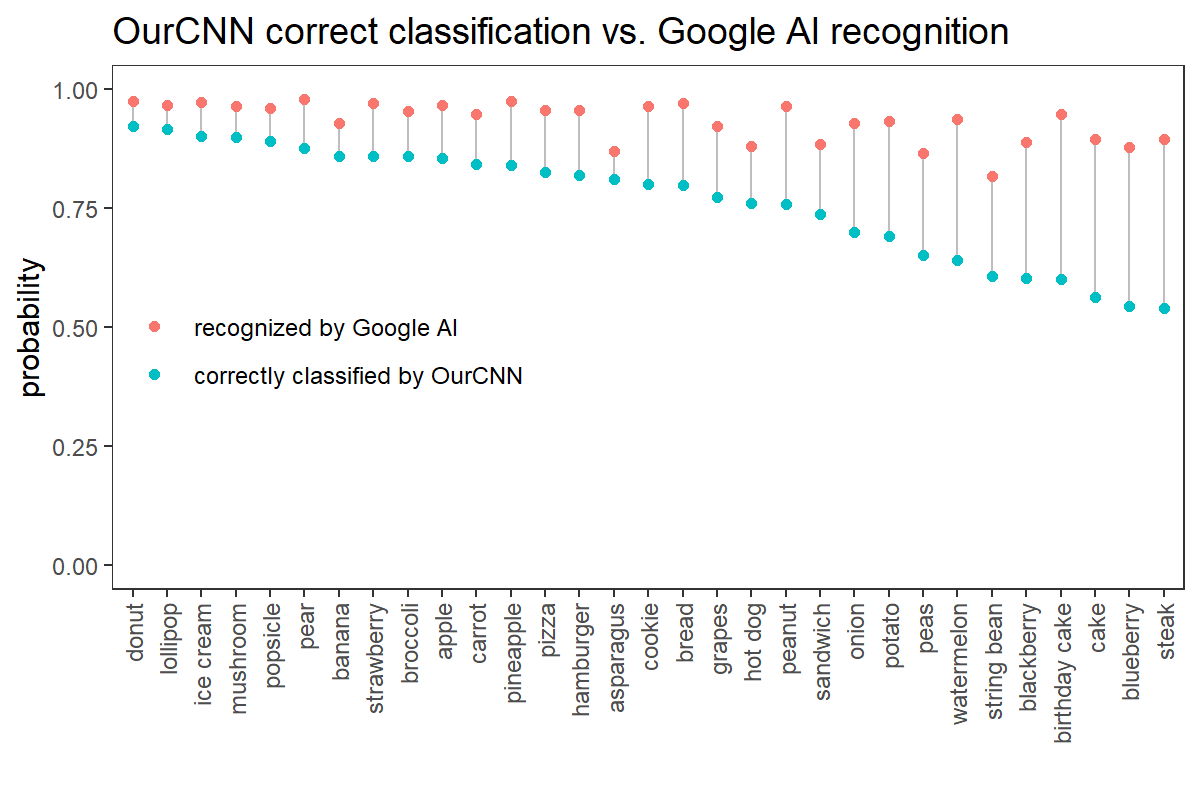
Hah, OurCNN is outperformed on ALL these food types.
It is amazing that on those that OurCNN really struggles to differentiate, Google AI has recognition rates of 8x-9x percent! And this is even more awesome (for Google!) when you remind yourself that Google AI has to differentiate among 340 different things. OurCNN has the much simpler job of differentiating only 31 of those things (sorry, we don’t care much about non-foods).
On Google-recognized images
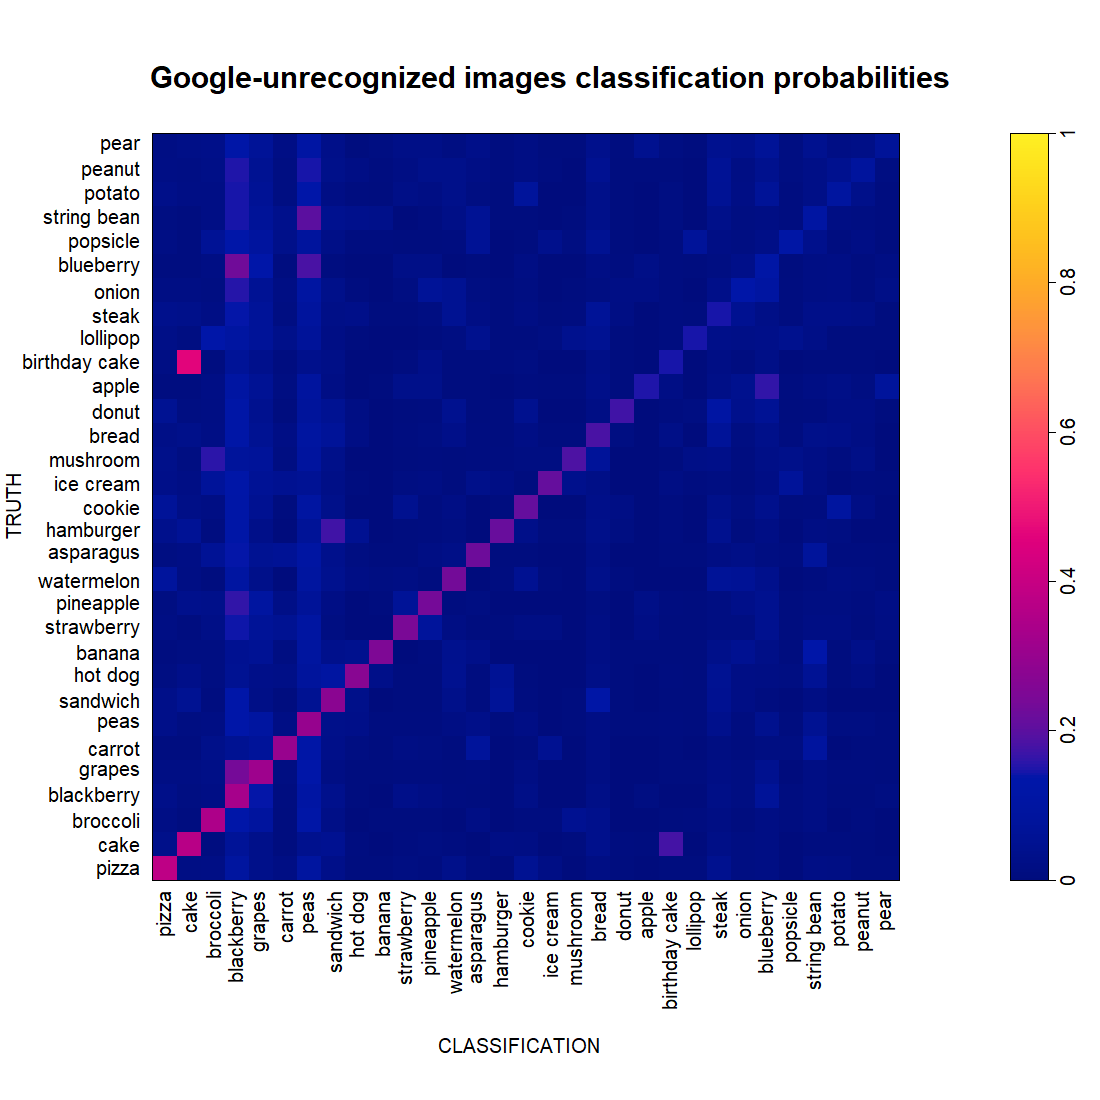
As OurCNN was trained on images whose category, it is appropriate to first look at how it performs on a random test set of Google-recognized images (again, 1000 images per food). This performance is shown in the classification probability matrix below, where the food types are sorted by classification accuracy.
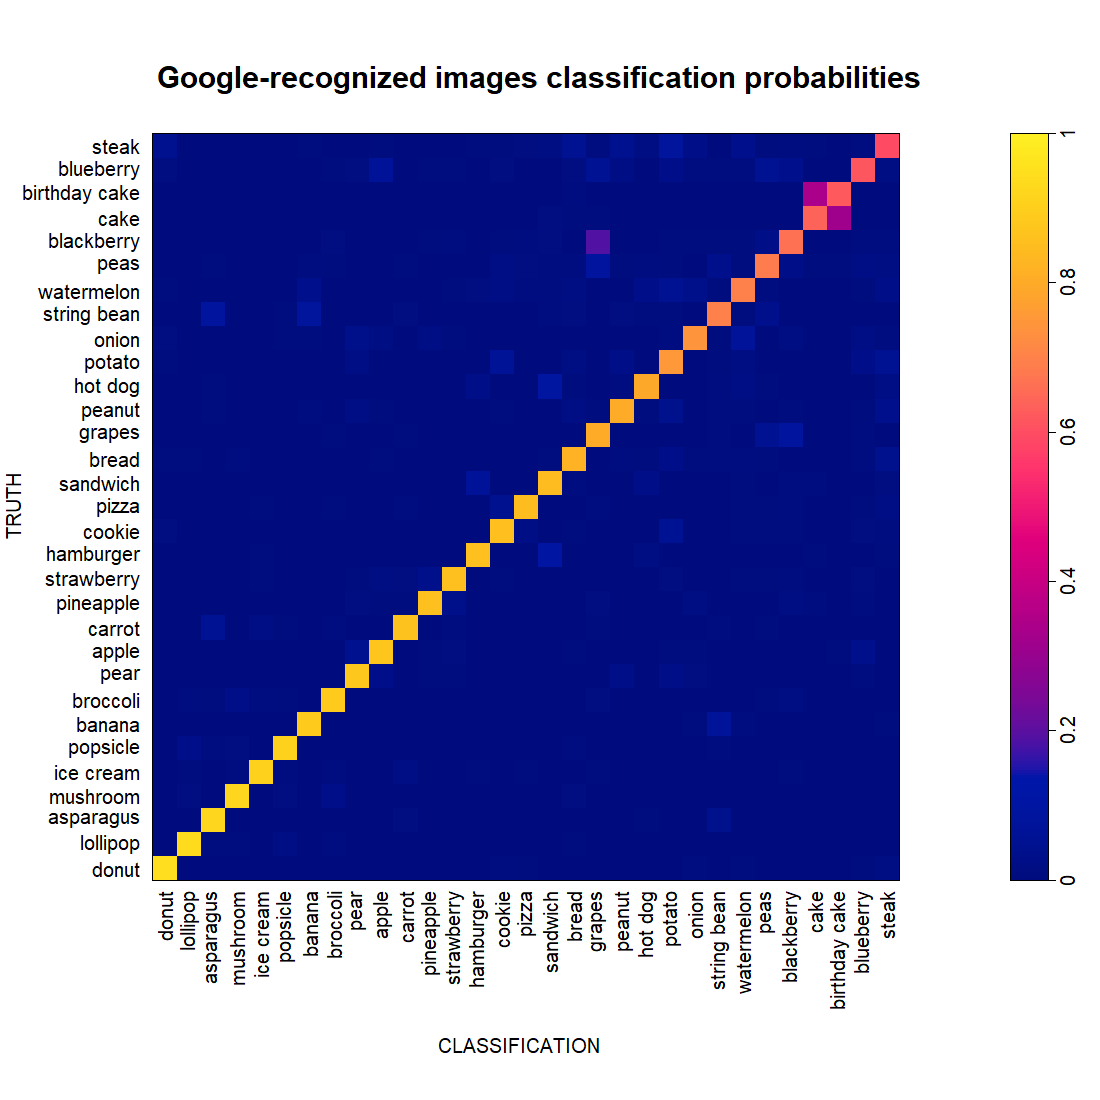
It does not bad!
OurCNN is a black box. We don’t know what goes on inside it, like what the filters look like, what the weights of the nodes are, what thresholds are involved in activation, what factors are used for batch normalization, etc. Well, maybe when we learn Python, we will be able to look inside the black box to see if we can gain some insight. (We implemented this using the R package keras and do not have access to appropriate functions to tease out information from the model object.)
But, we can observe OurCNN’s behavior to satisfy our human desire to learn.
It is clear OurCNN does better for some food types and worse for others. Cakes and birthday cakes are often confused. And from the perspective of OurCNN, some blackberries probably look like grapes.
Let’s zoom into the images that are misclassified and rearrange them a bit, so that we see what each food tends to be misclassified as.
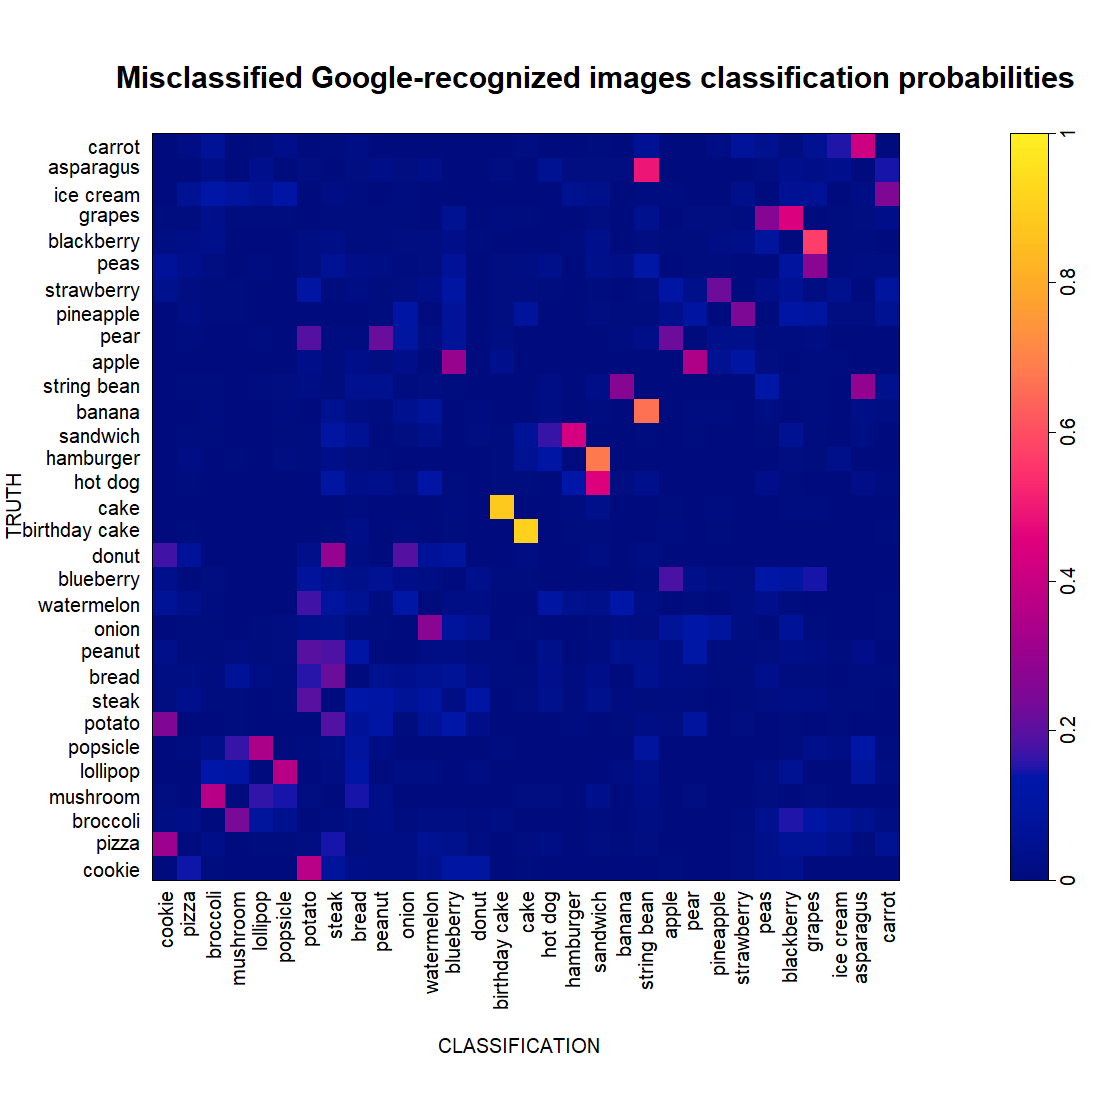
It looks like most of the confusion of OurCNN happens in pairs of food. Clearly, cake and birthday cake are a pair. Cakes are generally not cake-like enough because they look more like birthdday cakes, and birthday cakes are generally not birthday-y enough because they look more like cakes.
Other pairs are popsicle-lollipop, mushroom-broccoli, strawberry-pineapple, potato-cookie, pear-apple, string bean-banana, etc.
Some food types are involved in more than one pair. Grapes is in a primary pair with blackberry, and in a secondary pair with peas. String been is paired with both banana and asparagus. Apple is paired with both blackberry and pear.
There are some one-way relationships. Cookie is the object of classification for bad pizza but much less the opposite. Steak is an object of classification for donut, but not the other way around. Quite a few bad pears look like peanuts, but few bad peanuts look like pears.
Let’s look at several of the pairs.
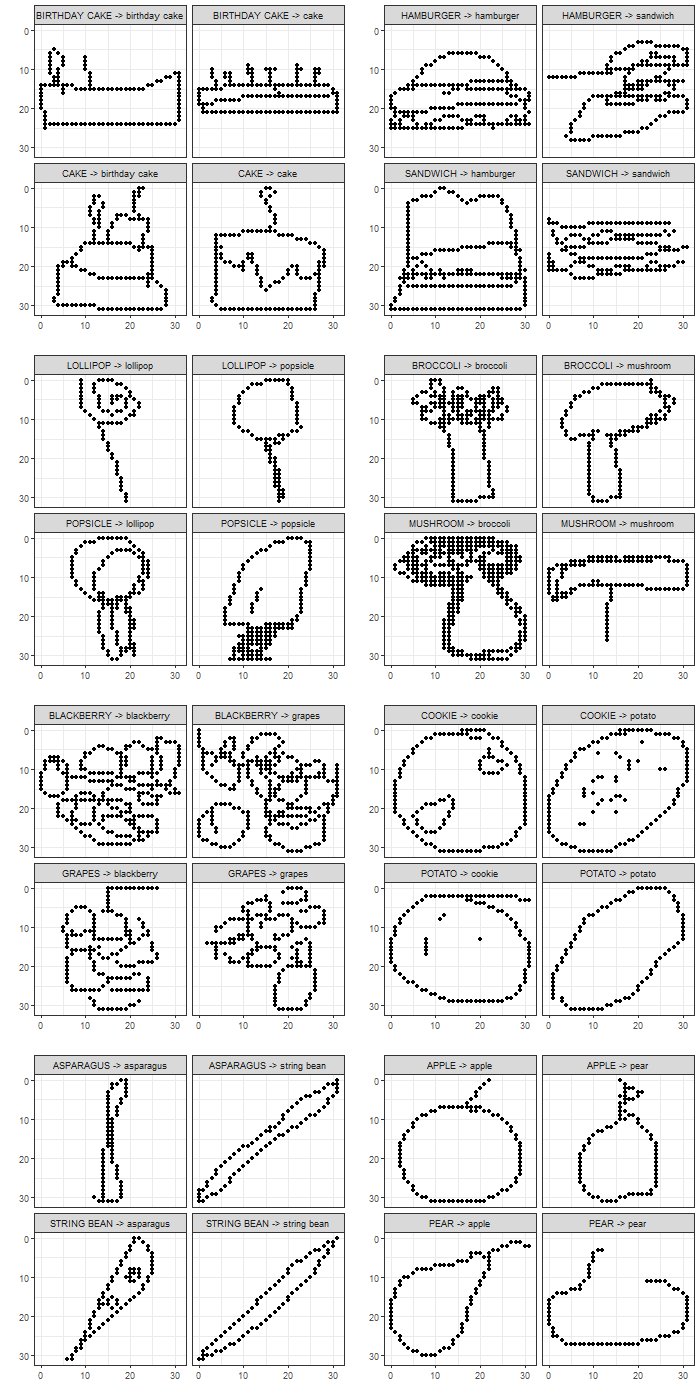
Interesting! Some of them, we can kind of see why. Some of them, not.
On Google-unrecognized images
We now subject OurCNN to a random set of Google-unrecognized images.
At the highest, OurCNN correctly classifies 38% of the pizza images in this set. At the lowest, 6.8% of the pear images. Contrast this with the probability of 0.032 when tossing a 31-sided coin.
It is interesting that there seem to be some favorites among the labels (blackberry and peas) for classifying any random category. Do bad drawings tend to have certain types of strokes that are commonly present in blackberry and/or peas drawings? Let’s look at some of these non-blackberries that are classified as blackberries (below, left) next to some good (Google-recognized) blackberries that OurCNN also classified as blackberries (below, right).
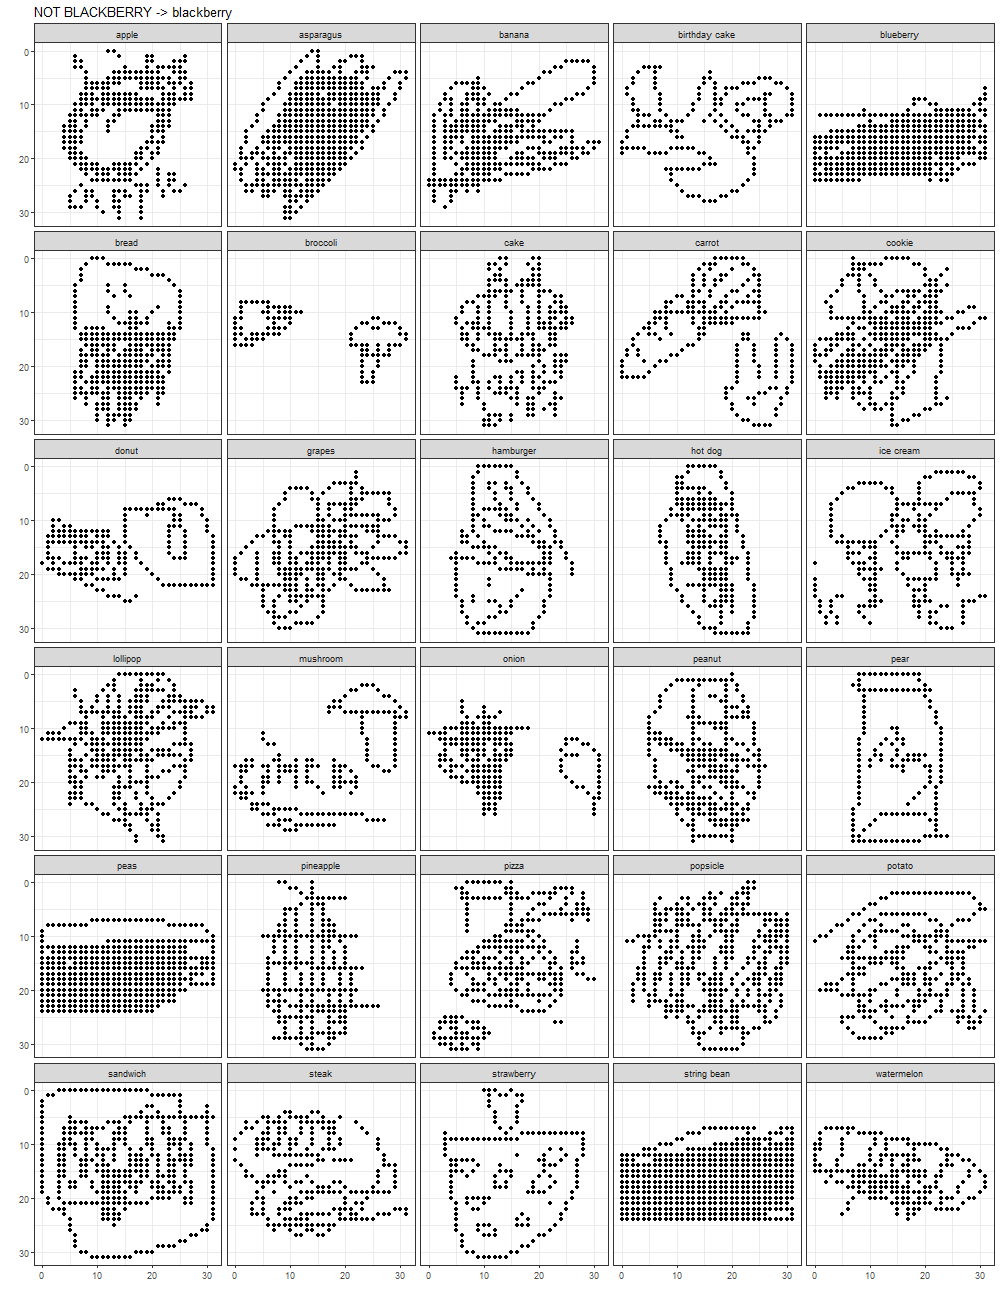
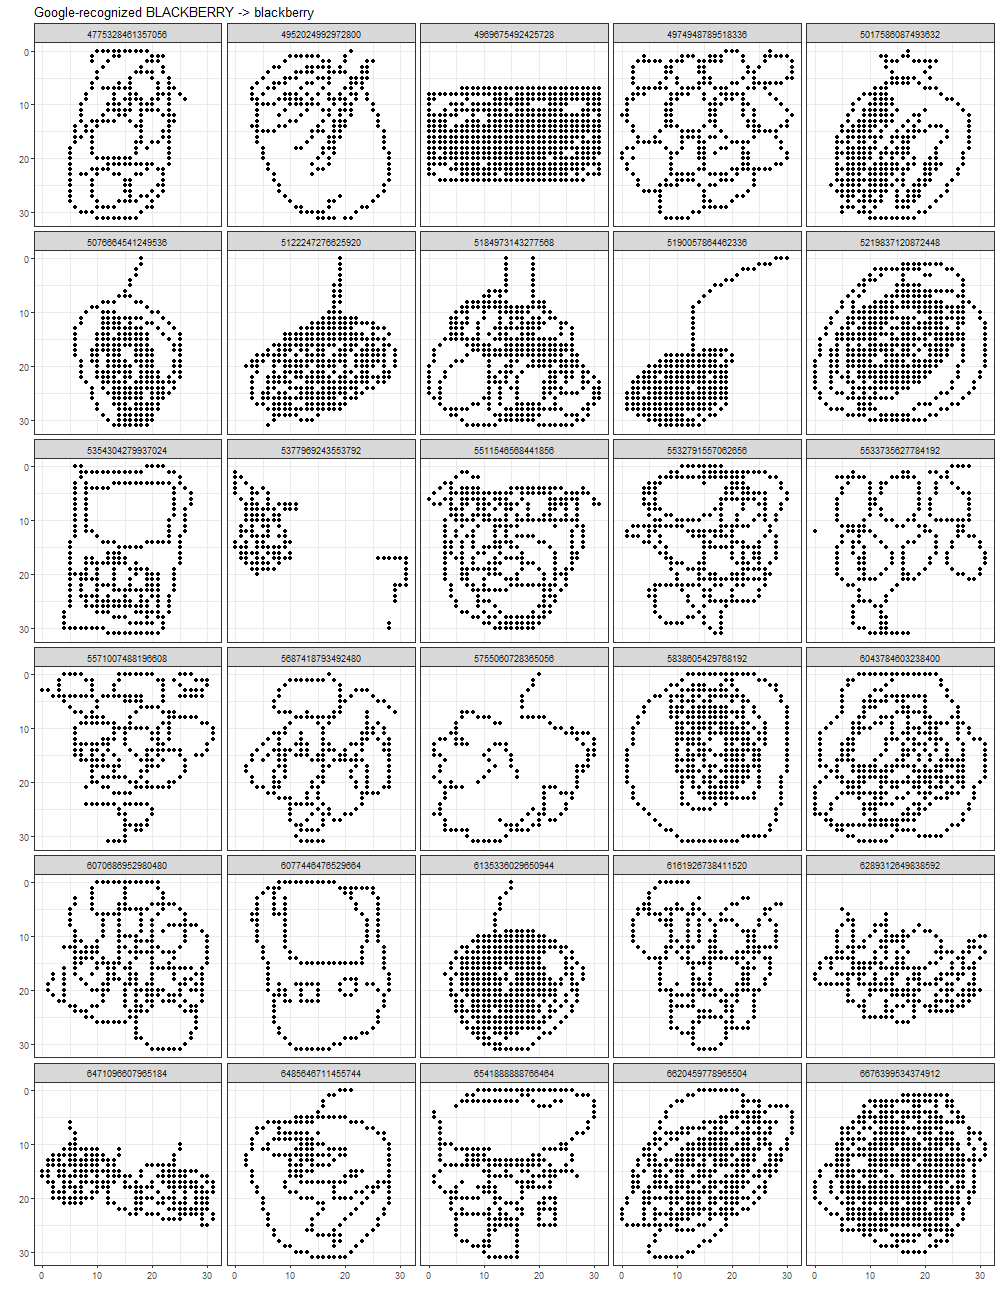
Perhaps the one thing in common between these two sets of images is that there are a lot of busy pixels!
Wait! Isn’t it super cool that OurCNN includes Blackberry the hand-held device?
To be complete, let’s also look at the classification probabilities of Google-unrecognized images that are misclassified by OurCNN.
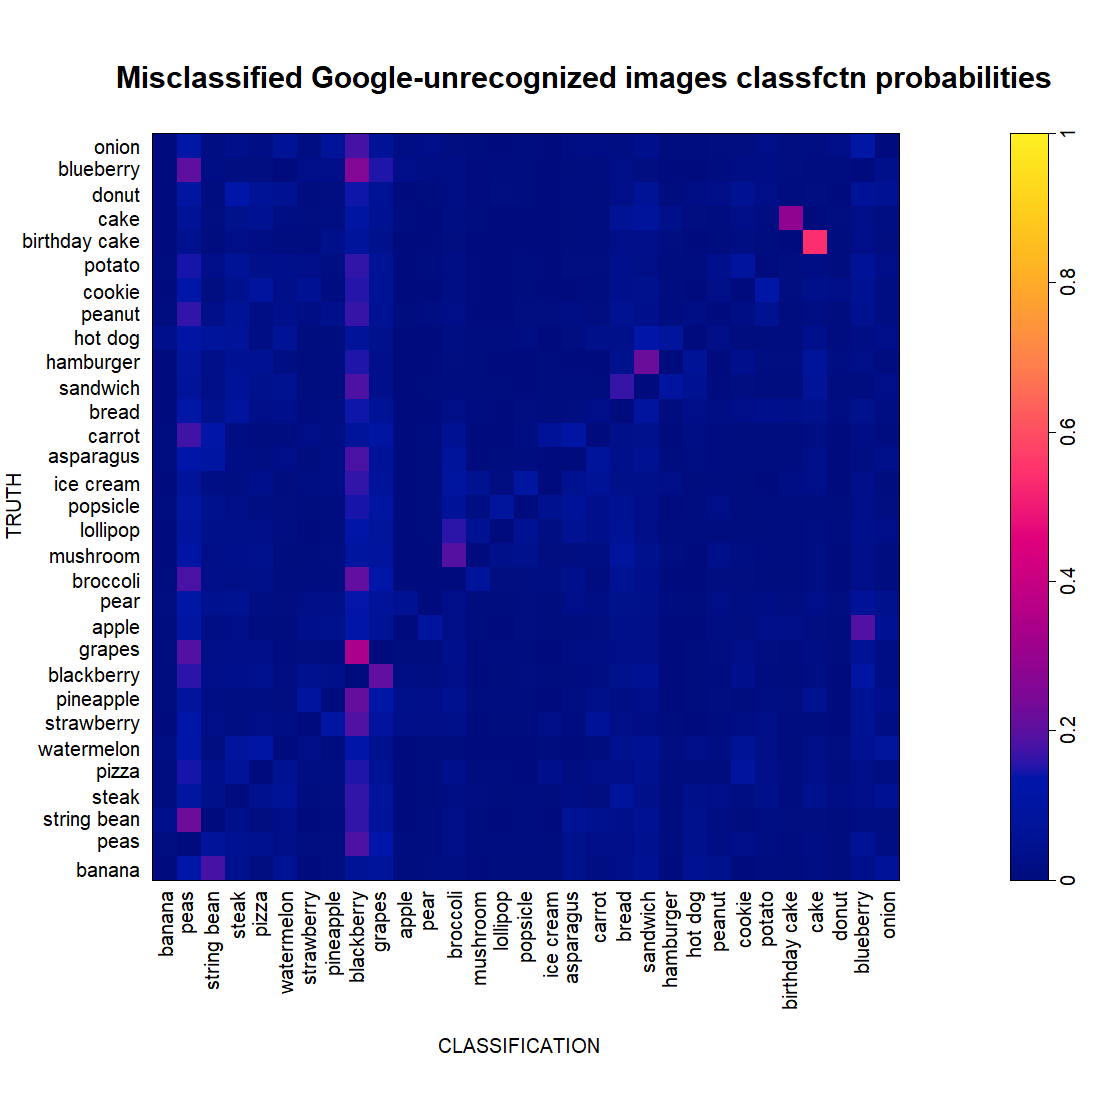
We do not see anything additional here that was not noticed before.
Parting words
This Unconscious approach works quite well.
While OurCNN is nothing compared to Google AI, it is limited by several resources that we guess do not affect Google AI: (1) we use only a fraction of the data to train the classifier (5K images/food type, compared to the 140-300K images/type available); (2) we wanted to try more powerful architectures, but could not handle them computationally.
We trained this version of OurCNN on a laptop. If we manage to use Hopkins’s cluster computing resources for the training, we would be able to see if we can get a more powerful version of OurCNN and see how it compares with Google AI.
Comparing these two early products – or prototypes, to be precise – from the Conscious and Unconscious approaches, we venture to say that the Unconscious approach is a serious contender. Perhaps humans and machines have different ways to see things that both are valuable.
But, let’s recognize that such comparison is unreasonable. We know well (from the data reduction plots above) that the MLE classifier is malnourished. With a lot more data (both data from each image and number of images), the MLE classifier might be a lot more powerful. Also, there are a lot of options for the conscious model building approach. We have seen five MLE models, but our human creativity can keep coming up with more models and better ones.
As for the unconscious approach, it would be nice to build a classifier that takes in a combination of image data and non-image features (e.g., country of orgin or anything else we might know about an image in a specific application), and thus uses all the available data for classification. We just have to go do that and come back to you.
Code and data for this component of our project are available here.